4.7/5 • 960+ students
Fast track your career growth Excel for Data Analytics
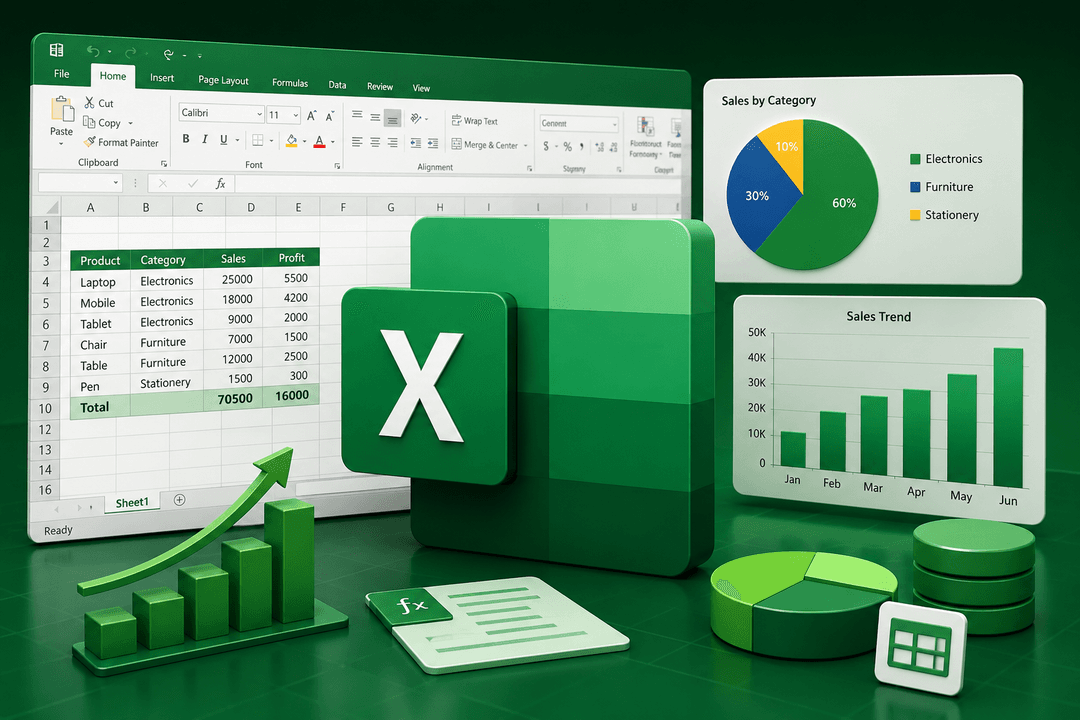
Go beyond basic spreadsheets: build dynamic reports, automate repetitive tasks, and analyze large datasets with PivotTables and Power Query.
- Hours of Instructor-Led Training
- Hands-on Projects across Web, Data & AI
- Includes Beginner → Expert Level Topics
- Mentor Support, Assignments & Code Reviews
- Job Assistance & Portfolio Guidance
- Jobzenter Certificate of Completion
What You'll Learn
Advanced Formulas
XLOOKUP, INDEX-MATCH, and logic.
PivotTables
Summarize and slice business data.
Power Query
Import, clean, and transform data.
Charts & Dashboards
Visual KPI tracking in Excel.
Data Validation
Quality checks and error control.
Automation Intro
Macros and repeatable workflows.
Course Content
- Workbook structure, tables, and named ranges
- Essential formulas: SUMIFS, COUNTIFS, AVERAGEIFS
- Logical functions: IF, IFS, AND, OR
- Lookup techniques: VLOOKUP, XLOOKUP, INDEX-MATCH
- Formatting for readable management reports
Frequently asked questions

Is advanced Excel still in demand?
Yes—Excel remains a core tool for analysts, finance teams, and managers. Power Query and Pivot skills are frequently listed in job descriptions.
Do I need Microsoft 365?
Modern Excel with Power Query is recommended; core topics work on recent desktop versions used in most workplaces.
Can beginners join?
We cover fundamentals first, then move to PivotTables and Power Query with guided exercises.